Running a vending business generates a surprising amount of data. Every transaction tells you something about a product, a machine, a location, and a particular point in time. Add inventory levels, product costs, commissions, expenses, and service visits, and it is easy to end up with more information than you actually know what to do with.
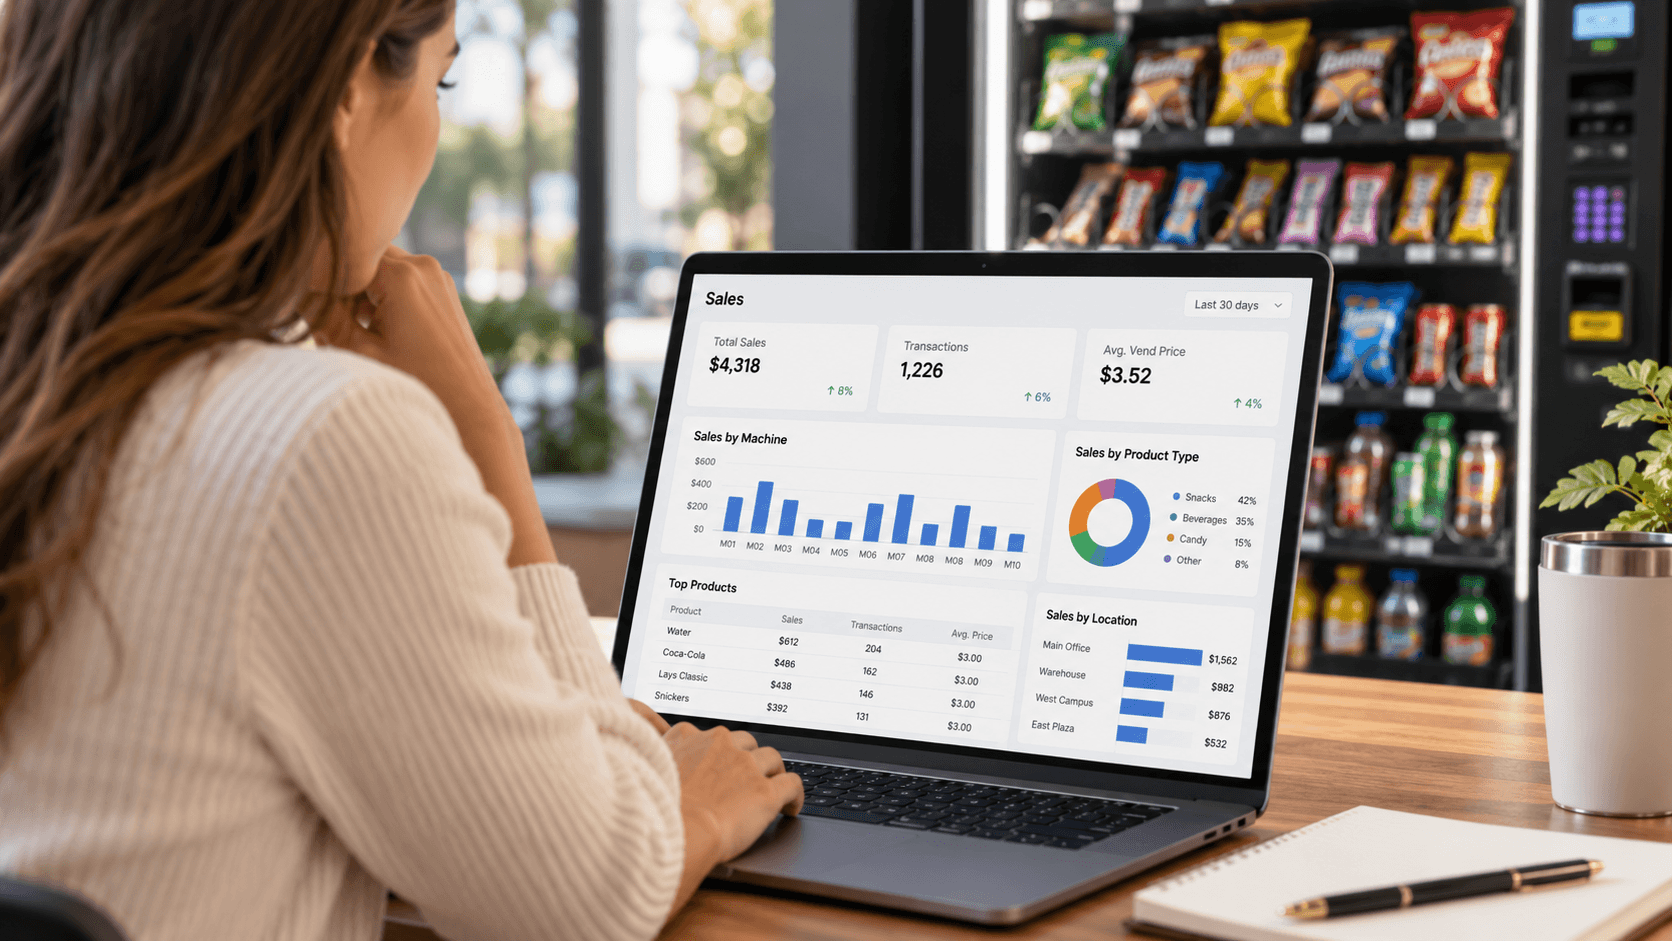
For most vending operators, however, useful analysis does not need to be complicated. You do not need dozens of KPIs or elaborate spreadsheets to understand how the business is performing. A relatively small number of questions can tell you where sales are coming from, which products are working, where performance is changing, and where it may be worth taking a closer look.
Start with sales by machine and location
Total monthly sales tell you how much the business sold, but they do not tell you much about what is happening within the operation. Two businesses generating the same monthly revenue can have very different performance at the machine level.
Looking at sales by machine helps separate strong performers from machines that contribute relatively little. Sales by location are equally important, particularly when several machines operate at the same site. A location with three machines should be evaluated as a whole as well as machine by machine.
The objective is not necessarily to identify the lowest-selling machine and remove it. Different locations have different operating costs and service requirements. Instead, machine and location sales provide a starting point for identifying where further investigation is worthwhile.
Look at real time trends, not isolated numbers
A machine generating $600 this month tells you very little without context. If it generated $400 six months ago, performance may be improving. If it previously generated $900, the same $600 deserves more attention.
Comparing sales over time makes it easier to identify gradual changes that are difficult to notice from individual monthly totals. Depending on the type of location, it can be useful to compare recent months, quarters, or the same period in previous years.
Seasonality should also be taken into account. Schools, offices, factories, tourist locations, and other sites can have predictable periods of higher and lower demand. The purpose of looking at historical sales is to distinguish normal variation from a meaningful change in performance.
Find out which products are actually selling
Overall machine sales are only one part of the picture. Product-level data can tell you what customers at each location actually buy.
Start with the products that generate consistent sales and those that sell very slowly. A product that performs well across most of your route may perform poorly at one particular location, while another product may have unusually strong demand there. These differences can help you adjust the product mix rather than treating every machine the same way.
Product sales can also help with purchasing decisions. If an item moves slowly across the entire operation, keeping large quantities in the warehouse may tie up money unnecessarily and increase the risk of expiration. Consistently strong sellers, on the other hand, need enough stock to support regular restocking.
This does not require constant changes to the planogram. The aim is to use actual sales history when deciding what deserves space in a machine and what quantities are reasonable to keep on hand.
Pay attention to vending machine inventory stockouts
A product with strong historical sales that suddenly stops selling does not necessarily mean customers have stopped wanting it. It may simply have been unavailable.
This is why sales data and inventory information are more useful when considered together. Frequent stockouts can reduce sales while also making product performance harder to interpret. VMS helps prevent stockouts with low stock alerts, and GearChain provides low-stock alerts before machines run empty so operators can avoid empty machines turning into lost sales. If a popular selection repeatedly reaches zero before the next service visit, the issue may be the quantity stocked, the capacity assigned to the product, the frequency of visits, or the need for proactive alerts.
The opposite is also useful information. If products regularly return from one service cycle to the next with very little movement, the machine may be carrying more inventory than it needs.
Sales and profit are not the same thing
Revenue is usually the easiest number to track, but a machine with high sales is not automatically the most profitable machine in the business, especially when both cash and cashless payments are involved because cashless payments minimize blind spots in revenue tracking.
Product costs are an obvious factor, but there may also be location commissions, card processing costs, machine-related expenses, fuel, maintenance, and other operating costs. Log the exact wholesale price of every item for better cost analysis. Two locations with similar sales can therefore contribute very differently to the business. Count cash and digital sales weekly to catch discrepancies.
This is particularly important when comparing locations. A high-volume account with a substantial commission and frequent service requirements may not be as attractive as its sales figures initially suggest. Looking at profit alongside revenue provides a more useful basis for comparing performance. Good financial reporting can also automate tax calculations and commission payouts, not just gross sales.
Consider how much work each machine requires for vending operators
Sales data becomes more useful when it is considered alongside the way machines are serviced.
A machine may generate reasonable revenue but require frequent trips because of limited capacity or an inefficient product mix. Another may generate slightly less while fitting conveniently into existing routes, which can help optimize routes to reduce fuel expenses and improve labor efficiency.
Service frequency can therefore provide important context. If you are repeatedly visiting a machine to fill only a small number of products, the schedule may need adjusting. Smart pre-kitting can calculate needed products before the truck leaves, reducing wasted time on the route. If a machine regularly runs out of its best sellers before the next visit, it may need more frequent service or changes to its planogram.
The goal is not simply to maximize sales from every machine. It is to operate the route efficiently while keeping enough inventory available to meet demand, with real machine data helping VMS cut service calls through better route decisions and fewer trips.
Use the data to answer specific questions
One of the easiest ways to overcomplicate vending analytics is to look at reports without knowing what you are trying to find.
A better approach is to start with a practical question. Why did sales at this location fall last month? Which products should I purchase more of? Which machines are growing? Which products are repeatedly selling out? Is one location requiring too many visits relative to its sales?
Once the question is clear, it becomes much easier to decide which information matters. Sales by location can help investigate a declining account. Sales by product can support purchasing and assortment decisions. Inventory information can identify stock problems. Profit and expense data can provide a more complete picture of what a machine or location contributes financially.
This approach also reduces the temptation to track metrics simply because they are available.
Build a simple review routine
For a smaller vending operation, there is usually no need to analyze every report every day. A simple routine is more practical.
Operators can periodically review overall sales and compare them with previous periods, check machine and location performance for significant changes, review the strongest and weakest-selling products, and investigate unusual results. Inventory, expenses, commissions, and service activity can then provide additional context where needed.
As the operation grows, these reviews become more valuable. Changes that are obvious when you have five machines are much easier to miss when you have fifty or several hundred.
Keeping the information in one place with vending management software
The practical value of vending data depends partly on how easy it is to access and compare in one place rather than rely on manual tracking in spreadsheets and separate records. If sales, inventory, purchases, expenses, and service information are kept separately, understanding what happened at a particular machine can require considerable manual work.
VendSoft brings this information together in a single platform as vending management software, giving operators more visibility through vending machine inventory tracking so they can review sales by machine, location, and product, monitor inventory, record purchases and expenses, and use trip data to track servicing activity. For machines connected through supported telemetry integrations, sales data can also be imported automatically rather than entered manually. Real-time updates reduce manual logging when telemetry-connected machines report automatically.
The purpose is not to analyze every number available. It is to have enough reliable information to answer the questions that affect day-to-day decisions.
For most vending businesses, that is what useful sales analysis comes down to: knowing what is selling, where it is selling, how performance is changing, and whether the revenue being generated justifies the inventory and work required to produce it.
See what your own vending data can tell you. Start your free 14-day VendSoft trial— no payment info required.
Want more vending business tips?
Subscribe to our free 2-week email course and learn how to start a successful vending business.