At the end of the month, a vending operator looks at one of their machines and sees $1,284 in sales. Is that good? In terms of vending machine performance, not by itself. Performance means looking past total sales to the data that shows how the machine is actually operating: which products are selling, how efficient service visits are, what inventory is sitting too long, and whether the machine is truly profitable. A well-placed machine might do a few hundred dollars a week, and high-traffic locations can go much higher, but even that benchmark only tells part of the story.
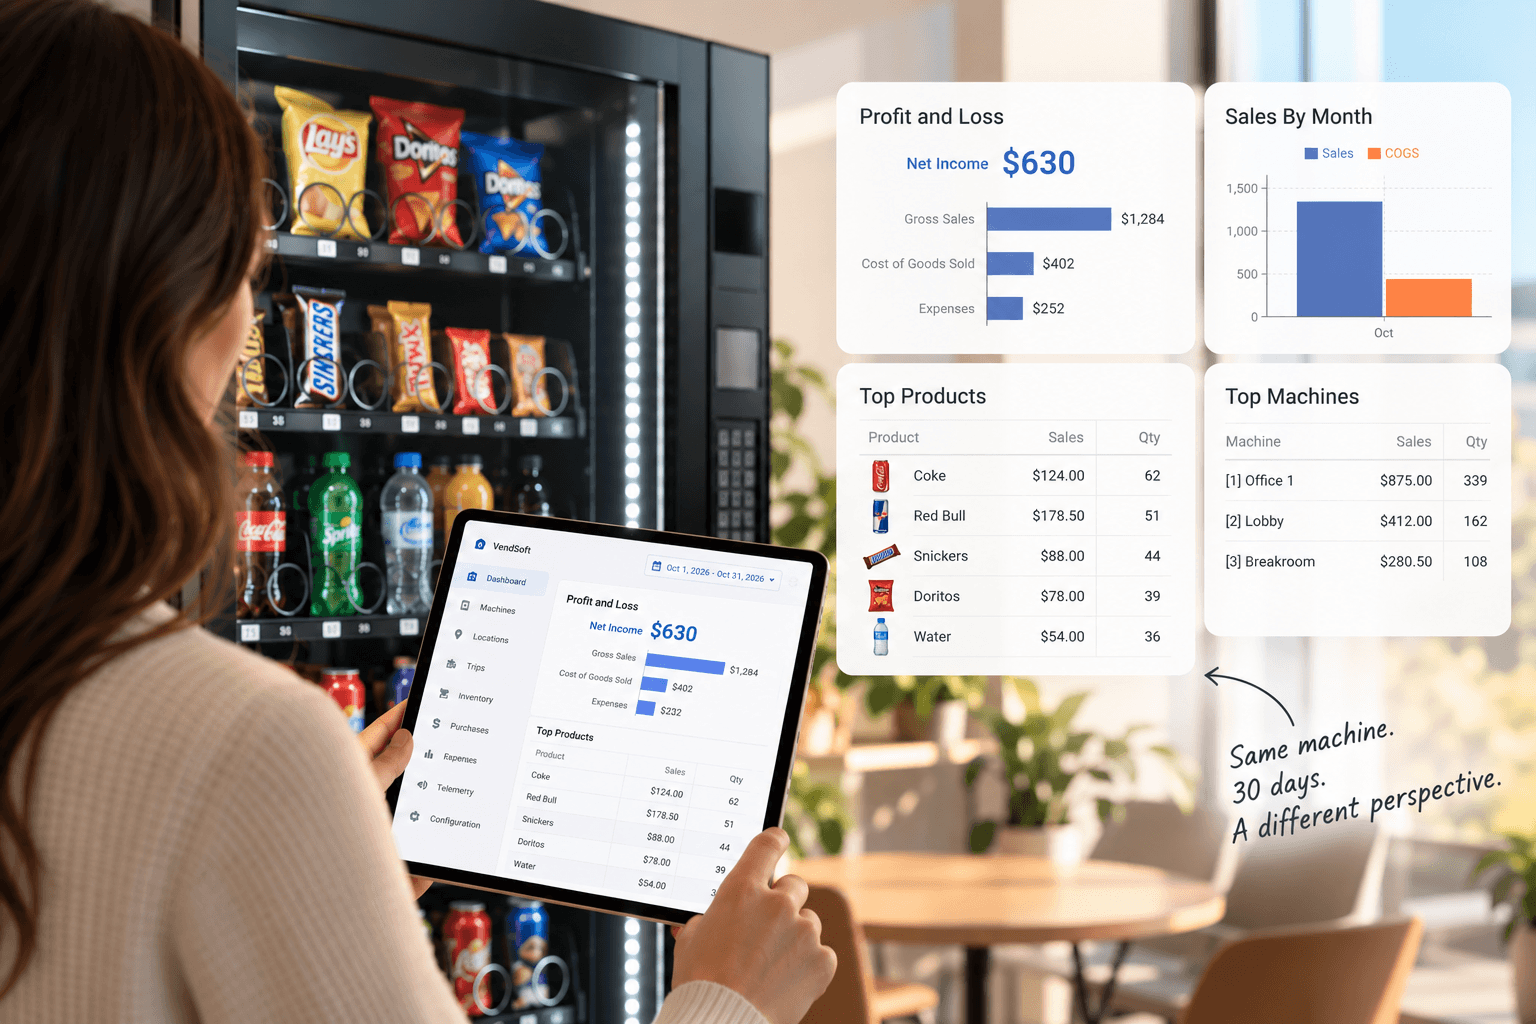
It certainly tells us that the machine is being used. But on its own, that number doesn’t tell us whether the right products are being stocked, whether the machine is being serviced at the right time, whether some selections are sitting untouched, or even whether the machine is particularly profitable.
To see what is really happening, let’s look at the same machine over a full 30-day period.
For this example, we’ll use a snack and drink machine in an office location. During the month, it generated $1,284 in sales and was serviced four times. The figures are illustrative, but the decisions they reveal are the same ones vending operators and route managers can make by evaluating sales by product, service timing, slow-moving items, and machine profitability so they can stock better, schedule smarter, control costs, and improve results across their machines.
$1,284 in sales volume doesn’t tell the whole story
The first thing worth looking at is not simply how much the machine sold, but what people actually bought. In this case, $1,284 is sales revenue per machine over 30 days, not a full performance picture.
Although the machine carries dozens of selections, its sales aren’t distributed evenly between them. A relatively small group of products accounts for a large part of the month’s activity. Coke sold 62 units, Red Bull 51, Snickers 44, Doritos 39 and water 36, which shows product-level velocity by SKU. At the other end of the machine, several products sold only a handful of units during the entire month.
This matters because every selection has limited capacity. If a popular drink repeatedly gets close to selling out while another product beside it sells three units in a month, the problem isn’t necessarily that the machine needs more inventory. It may simply have the wrong inventory in the wrong places.
That’s an important distinction. A machine can look reasonably full overall and still be poorly stocked for the demand at that particular location.
Looking at sales by product gives the operator something actionable to take into the following month. This kind of sales data, tracked per machine, helps identify top selling products and phase out low-rotating SKUs. Instead of automatically filling every selection exactly as before, they can consider increasing the capacity given to the strongest sellers, replacing products that consistently underperform, or simply watching those selections more closely before making a permanent change. Optimizing the product mix can improve both sales volume and margin.
Four service visits doesn’t necessarily mean four necessary visits
Now let’s look at how the machine was serviced.
The operator visits this location every Monday. It’s convenient, predictable and easy to remember, so the machine received four visits during our 30-day period. Telemetry systems can automate collection of total sales and stock levels for better insights. But once we compare those visits with the machine’s inventory and sales, the schedule starts to look less efficient than it first appeared.
On one visit, the machine was still around 80% stocked and only a relatively small number of products needed to be added. Later in the month, however, demand was much stronger. By the time the next Monday arrived, several popular selections were running very low and considerably more product had to be replenished.
The problem isn’t that a weekly schedule is inherently wrong. For some machines, once a week may be exactly right. But real time data from remote monitoring can show stock levels between visits instead of relying only on a fixed schedule. The problem is assuming that the calendar alone can tell you when every machine needs attention.
If this pattern continues, the operator has a useful question to investigate: could this machine be serviced three times during a typical month instead of four, with the visits timed more closely to actual demand? The stockout rate tracks empty product slots at the vending machine, so it is a useful signal to review before changing the schedule.
Removing even one unnecessary visit may not sound significant when looking at a single machine. Data-driven restocking schedules can increase sales by 15-25% while improving service efficiency. Across a route with dozens of machines, however, unnecessary visits add up to more driving, more time spent servicing and fewer opportunities to focus on machines that genuinely need attention, especially across multiple locations. Restock efficiency measures successful restocks versus missed opportunities, and route planning can also be improved with dynamic routing software when managing more machines.
The slow sellers are telling us something about machine performance too
It’s natural to focus on the products that sell the most, but the bottom of the sales report can be just as useful.
Suppose two selections in our example sold only three and four units respectively during the entire 30-day period. Those products are using space in the machine, tying up inventory and potentially increasing the risk of products eventually expiring, which can raise spoilage loss and product waste, while stronger sellers elsewhere in the same machine may need more capacity.
That doesn’t mean every slow seller should immediately be removed. A single month can be unusual, and some products may serve a particular customer preference even at lower volumes, especially when location demographics support keeping them. But repeated low sales are worth paying attention to.
This is where looking at the same machine over time becomes more valuable than reacting to an individual week. Inventory turnover rate calculates how quickly stock is sold, and regularly reviewing product turnover rates helps confirm when a slow seller should be replaced. If a product consistently sits in the machine while another selection repeatedly runs low, the operator has evidence to support a change rather than relying on intuition, and efficient stock management prevents expired or wasted stock.
The lesson from the month isn’t simply “stock more” or “stock less.” It’s to stock more deliberately by aligning product selection with regional tastes and demographics and with customer preferences at that location.
Then there is the question of profit and operating costs
So far, our $1,284 machine looks reasonably successful. But sales still aren’t the same as earnings.
The products sold during the month had to be purchased. The location may receive a commission. Four service visits required time and transportation, and there may also be payment processing fees, insurance premiums, and other expenses associated with operating the machine.
Once those costs are considered, the useful question changes from “How much did this machine sell?” to “What is its profit margin?” Gross margin shows profitability by comparing revenue to costs, while net profit margin accounts for all operational expenses.
This is particularly important when comparing machines. A location with impressive sales may also require a high commission and frequent servicing, while a quieter machine may be inexpensive to maintain and sit conveniently along an existing route. That means high performing machines by revenue are not always the most profitable, and underperforming machines may simply need lower costs, better pricing, or a different product mix. Looking only at revenue can make the first machine appear much more valuable than it really is.
We’ve covered this calculation in more detail in our guide to vending machine profit margins. For this particular machine, the important point is that profitability should be considered alongside the operational data we’ve already examined. If the machine required four trips to generate its monthly profit, would three better-timed trips have produced nearly the same result at a lower service cost?
That’s the kind of question that turns reporting into a business decision.
What would we do differently next month in our vending machine business?
After looking at the full 30 days, we haven’t discovered one dramatic problem with this machine. Instead, we’ve found several small opportunities to run it better.
For the next month, the operator might replace one or two consistently slow-selling products and give more space to a product that regularly runs low. Regular maintenance also helps prevent broken machines and out-of-stock items. They might also reconsider whether the machine really needs an automatic Monday visit every week or whether its service schedule could be based more closely on actual inventory needs, especially in high traffic locations that may need more frequent checks or even daily attention. On the next trip, they can bring quantities based on what the machine is likely to need rather than loading the vehicle with extra products “just in case.”
Then the process starts again. At the end of the following month, the operator can compare the results. Did the replacement products sell better? Did the popular selections stay available for longer? Was one service trip avoided? Did sales remain stable? Did machine uptime improve? Did the machine become more profitable?
Thirty days of data won’t tell you everything about a vending machine. Seasonality, changes at the location and unusual sales periods can all affect the results. But it can reveal patterns that are difficult to see when you’re simply visiting a machine, filling what’s empty and moving on to the next stop, including technical issues and downtime that can lead to lost sales.
And that’s ultimately the useful part of collecting vending data. The goal isn’t to have more numbers and reports. It’s to make the next decision a little better than the last one.
With VendSoft, you can track sales, inventory, product performance, trips, expenses and profitability in one place, helping you understand not just what happened at each machine, but what you may want to do differently next while monitoring machine performance and turning vending data into actionable insights across multiple machines. Start your free 14-day trial today — no payment information required.
Want more vending business tips?
Subscribe to our free 2-week email course and learn how to start a successful vending business.